functionHR Employee Survey Platform
Flexible and scalable
With the functionHR Survey Platform, you can smoothly collect feedback from all your employees – even from those who do not have their own e-mail address.
Not only can you create customized surveys, but also analyze the survey data in real time and communicate the findings to the right people in the company.
First class execution
From data collection to data integration and analytics – the functionHR Survey Platform is designed to streamline the entire process.
Smart questionnaires
We help you to choose the most appropriate survey and questionnaire design – with scientifically validated questionnaires from our experts.
Smooth user experience
Enable all your employees to participate in surveys – anytime, from any device. An engaging experience for everyone, thanks to the intuitive Survey Platform design.
Instant analytics
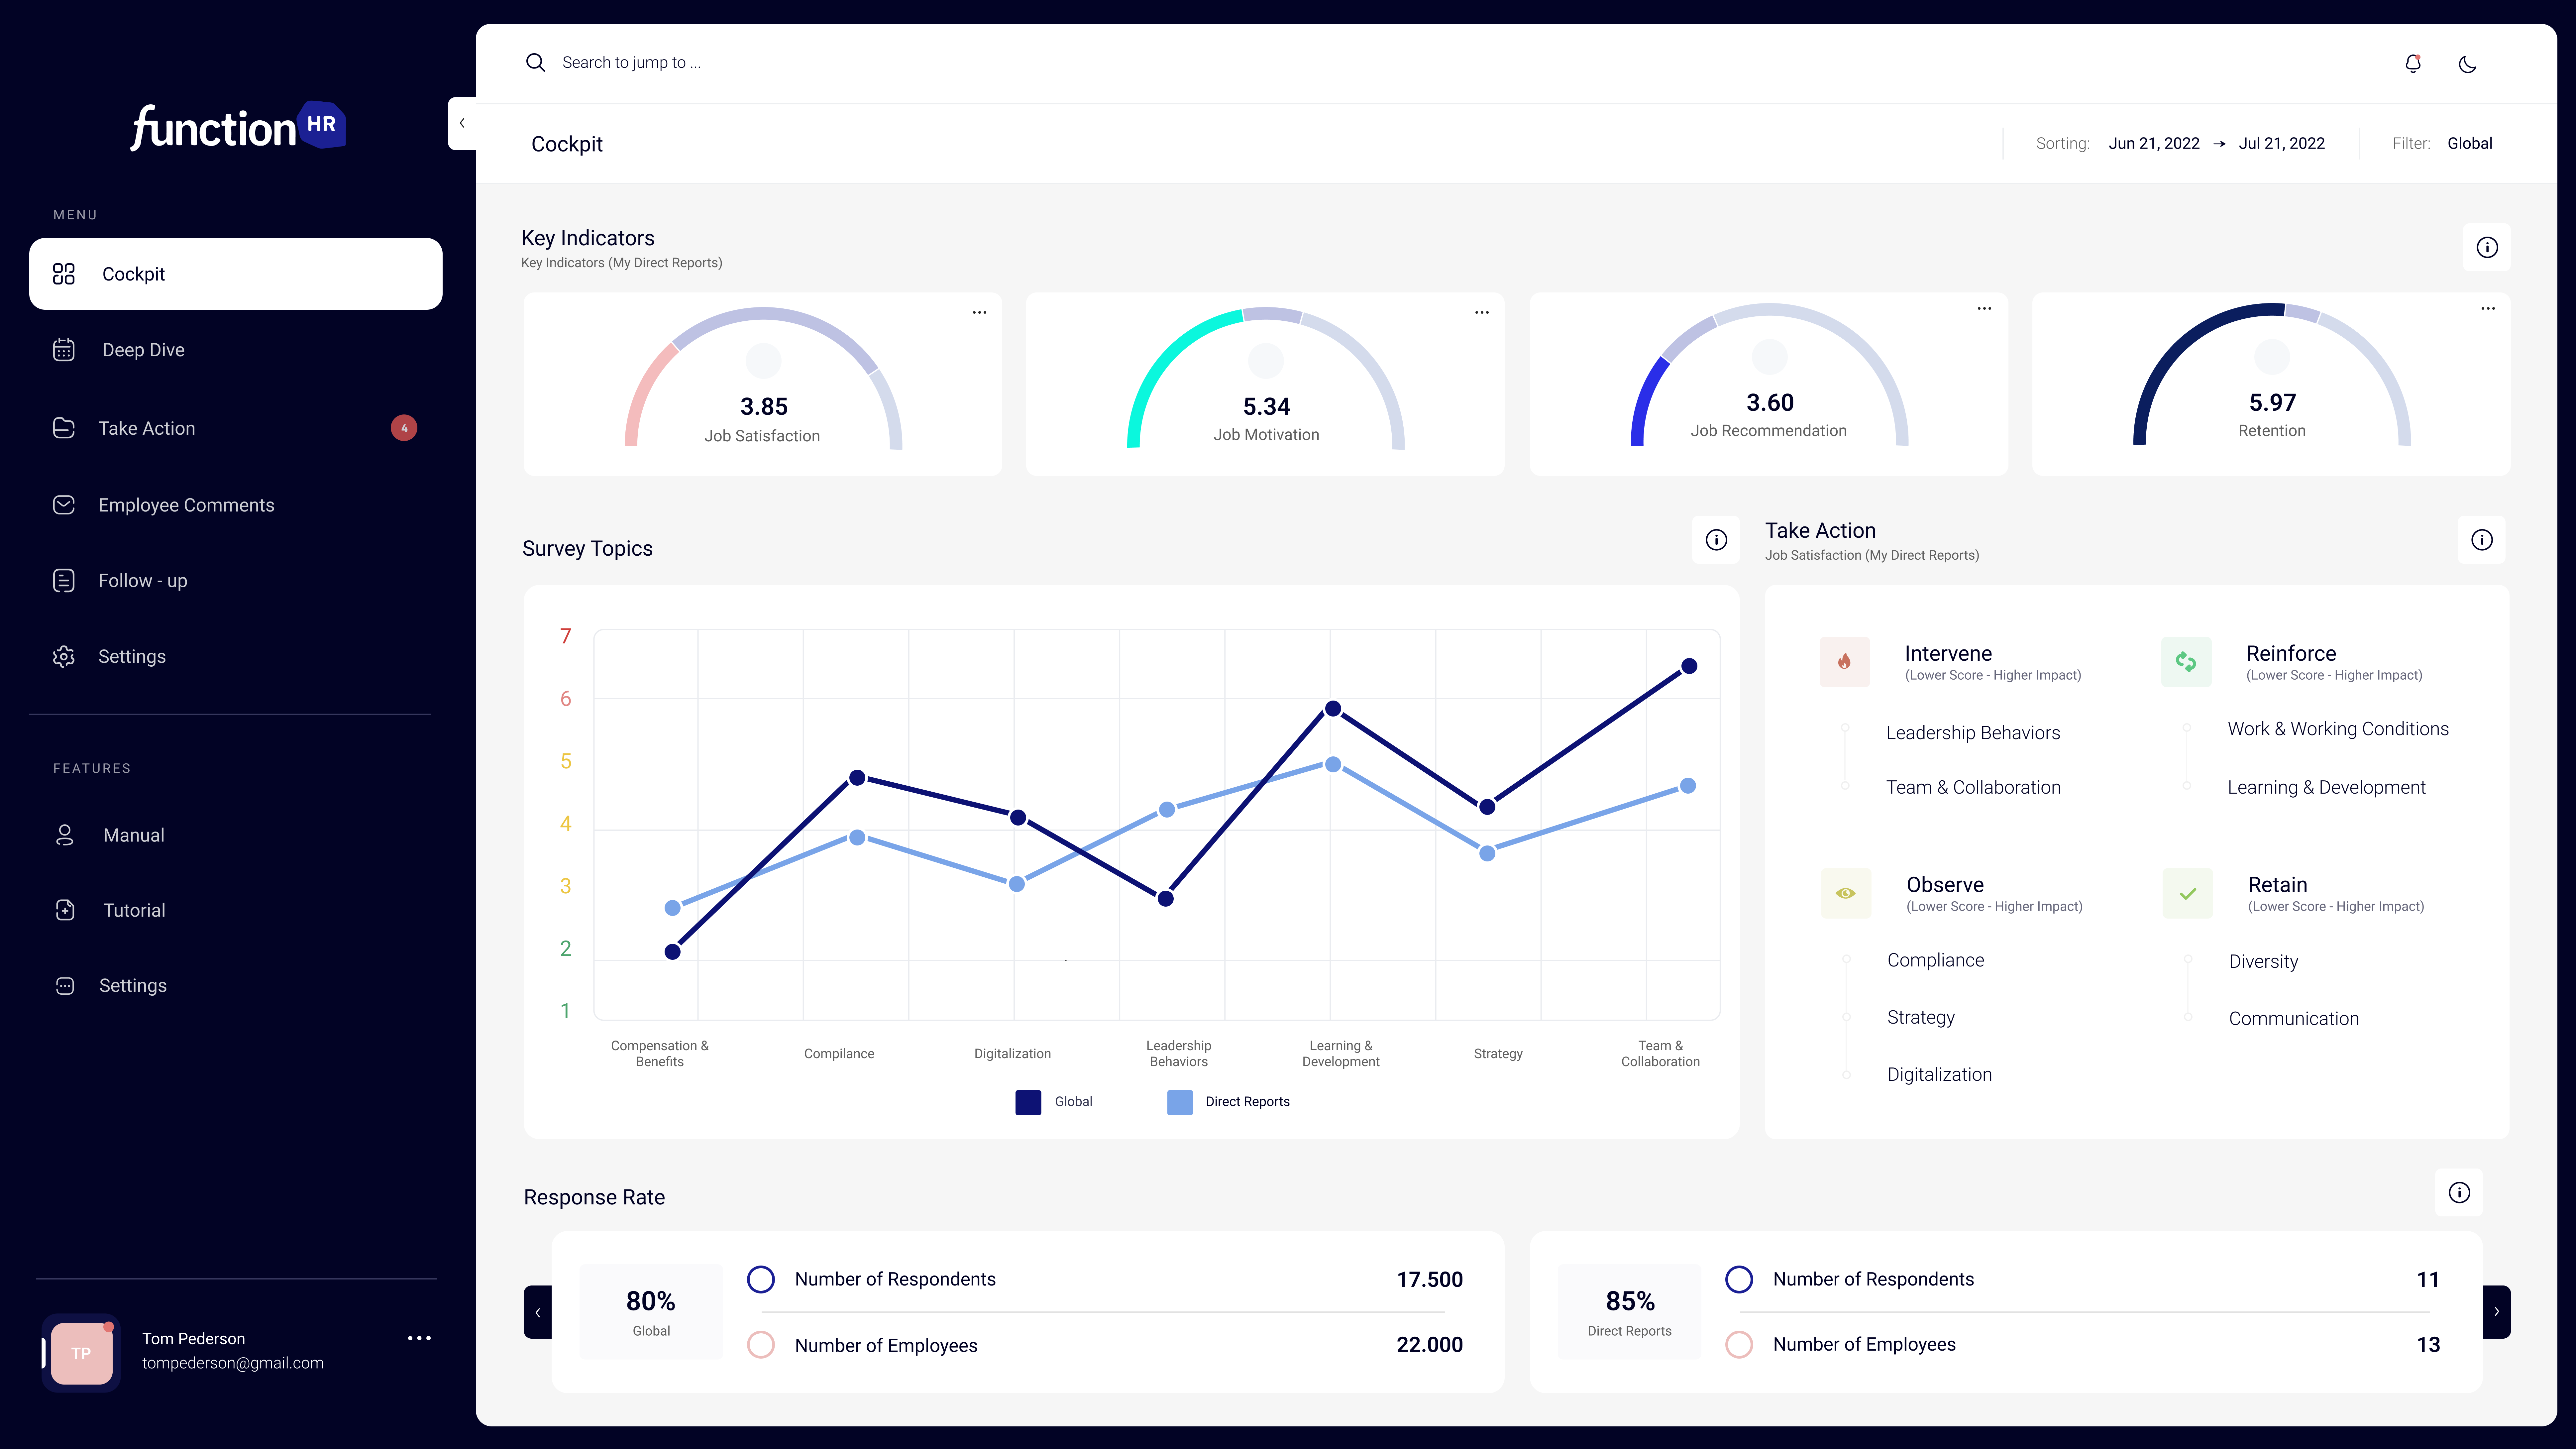
No more manual analyses. Survey results can be accessed via our intuitive dashboard, which is customizable for all user groups. Save time and benefit from automated reports in real time.
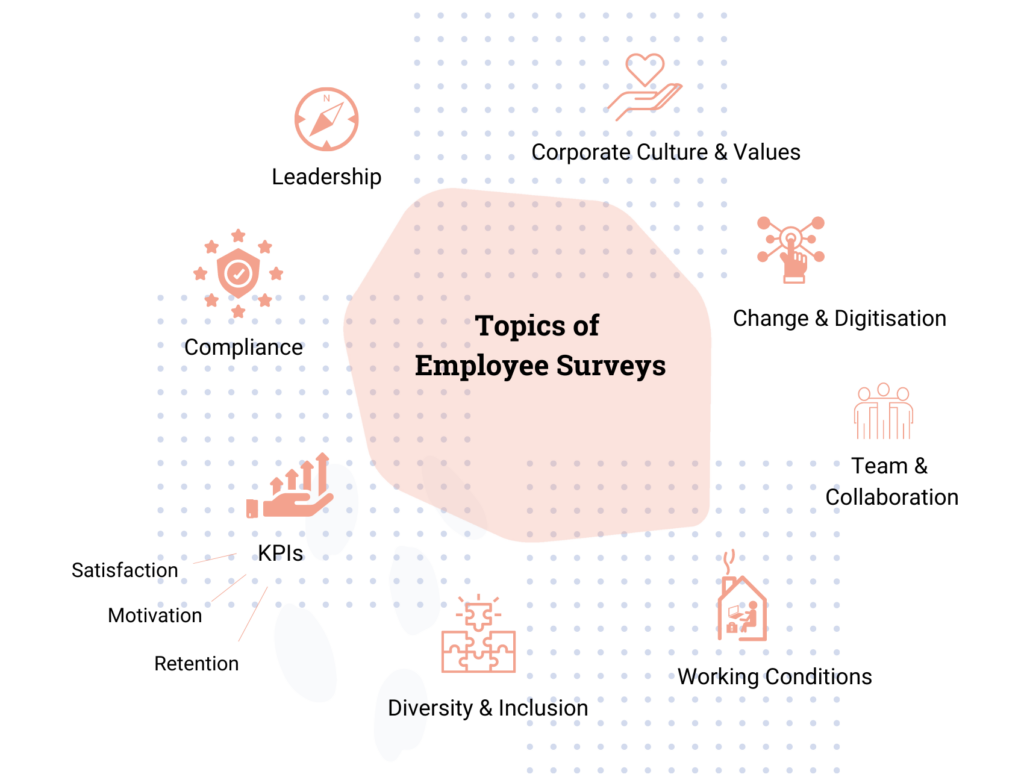
Questionnaire Design
Design your questionnaires flexibly
Best-practice catalogue of questions: Choose from scientifically validated questions on all important topics for employee surveys
Mix of question types: Combine closed and open-ended questions for a comprehensive data collection
Flexible customization: Integrate additional questions for specific departments/employee groups/locations
Individualization: Define the required survey languages and design the questionnaires in your corporate design
Collect feedback with different survey formats
Regular Survey
Capture employee perceptions with employee surveys.

Pulse Survey
Collect agile feedback with short and regular pulse checks.
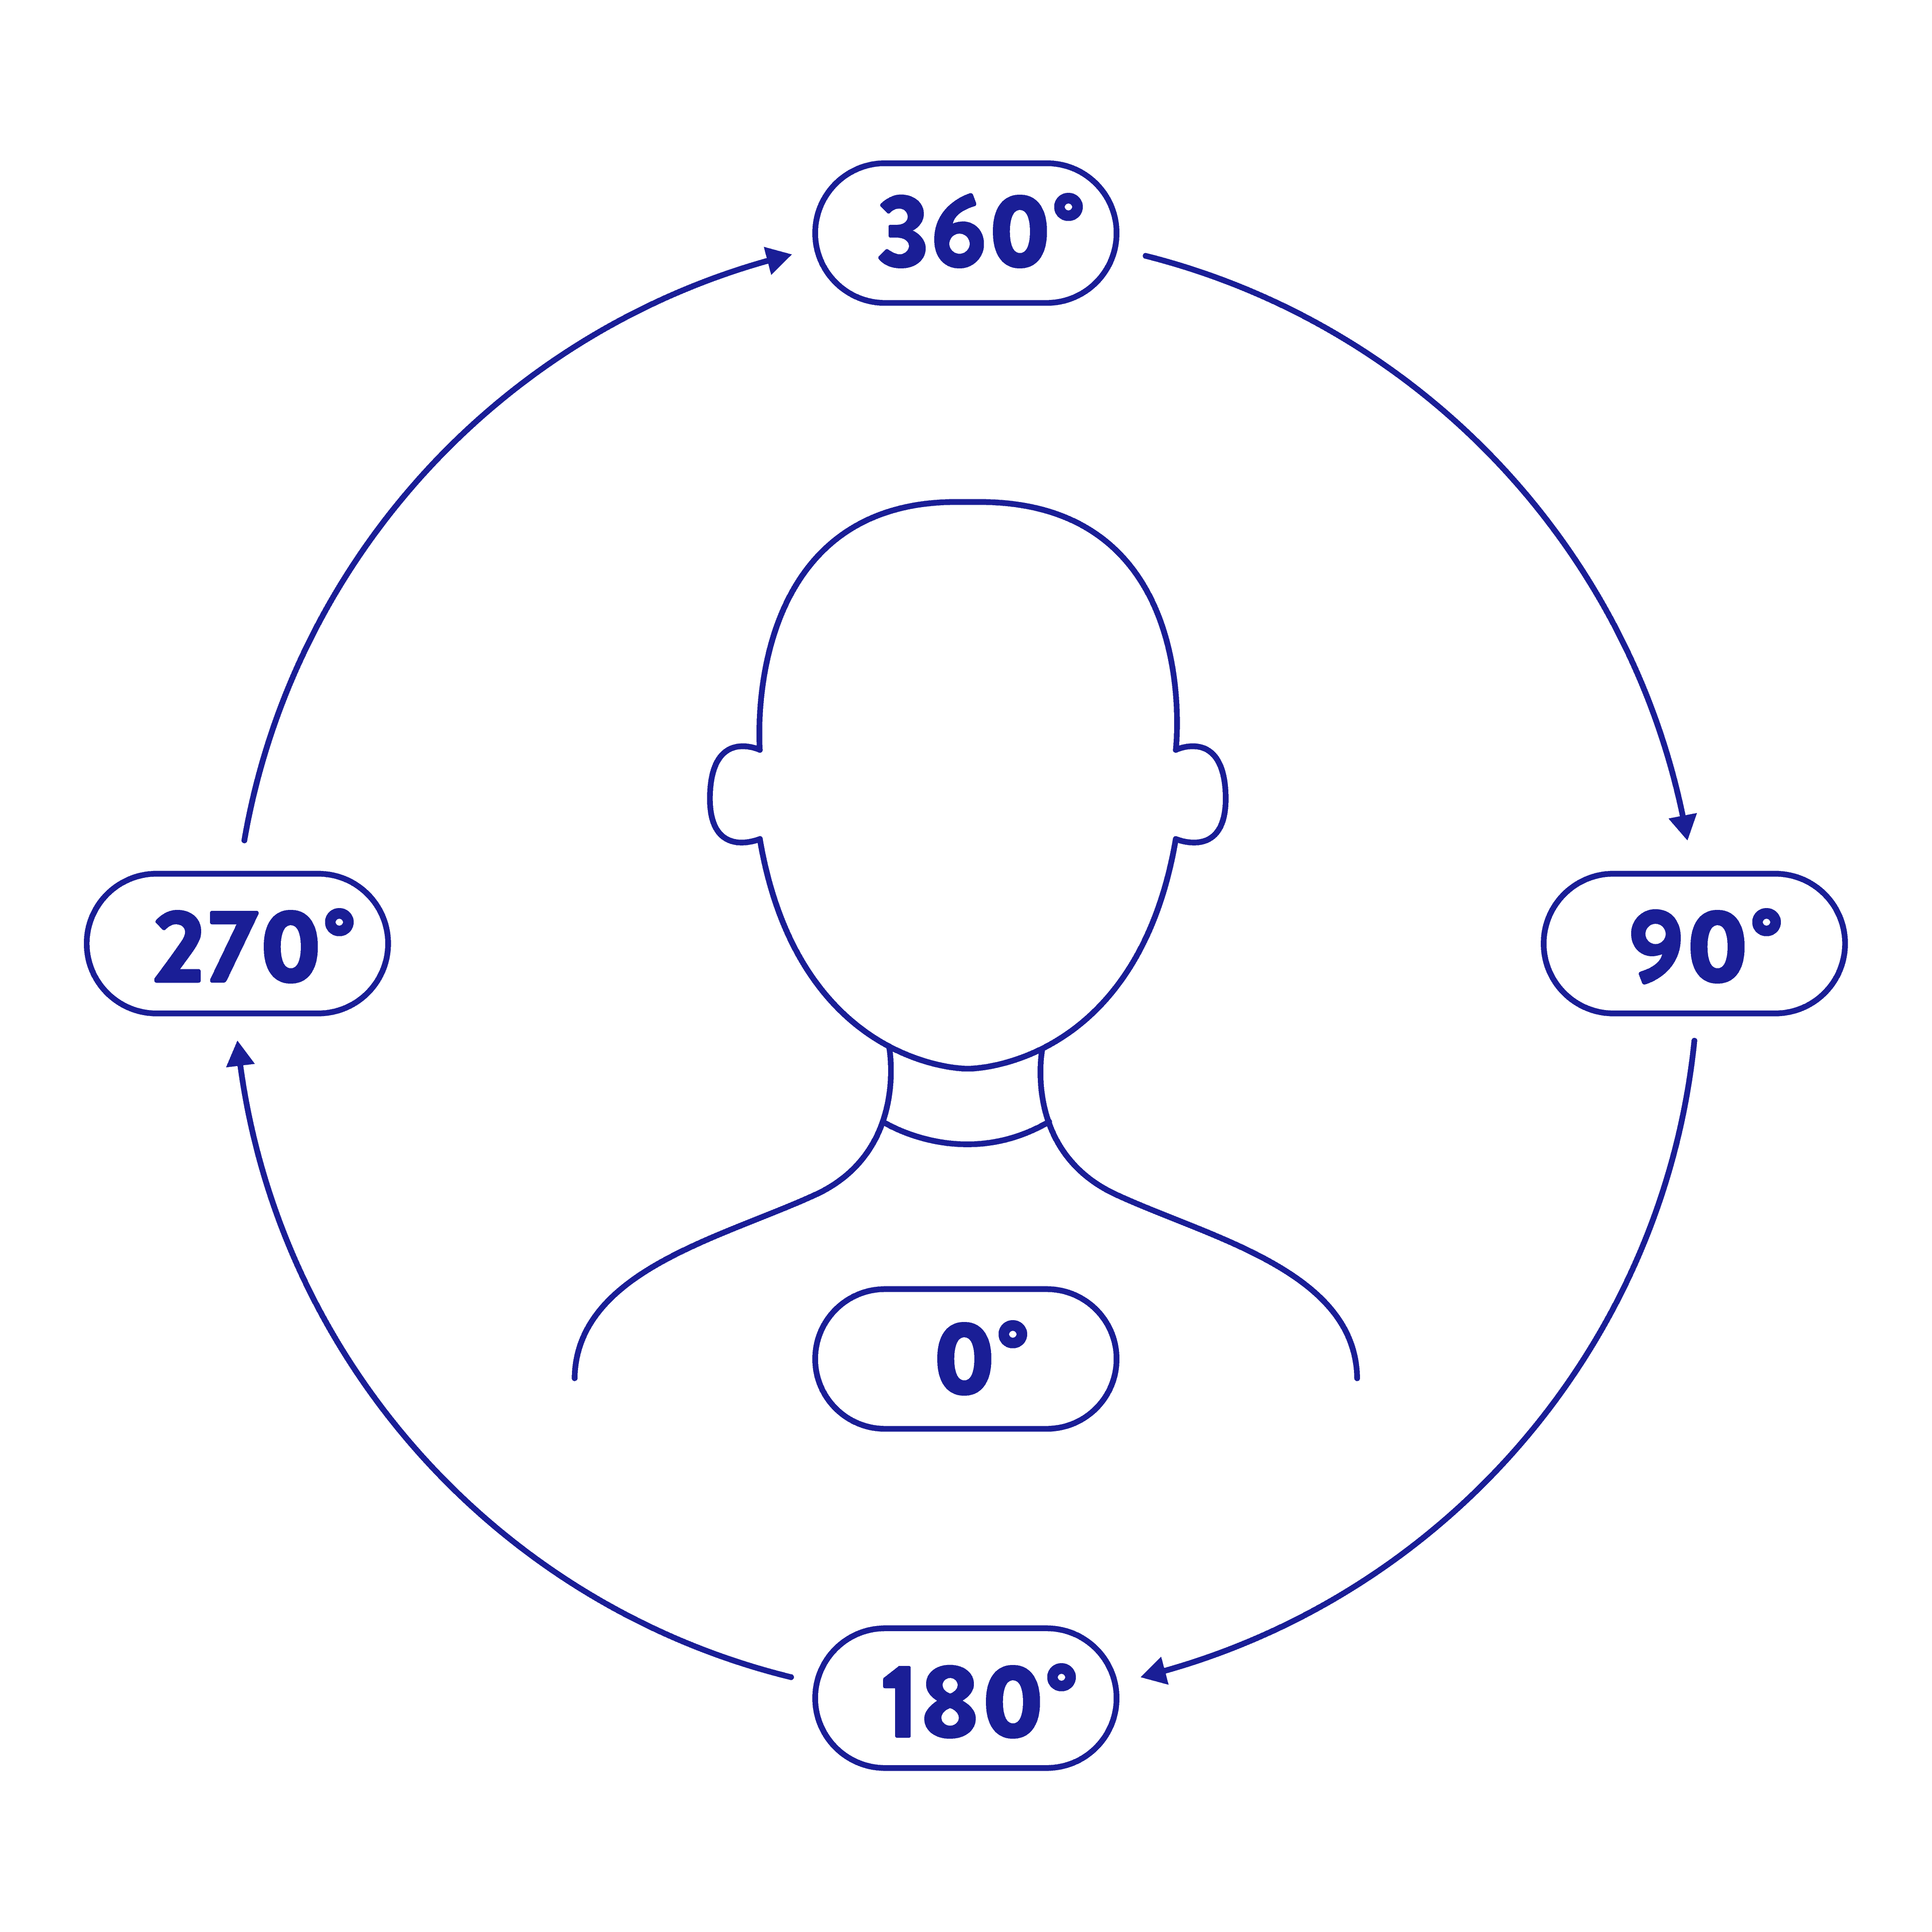
360-Degree Feedback
Empower your managers with our innovative multirater approach.
Continuous Listening
Accompany your employees on their employee journey and generate deep insights.
Befragungen Ihrer Mitarbeitenden aus der Produktion
Sie möchten die Meinung Ihrer Blue Collars einholen, wissen aber nicht wie? functionHR hat die passende Softwarelösung für Mitarbeiterbefragungen. Wir sind auf die Anforderungen im produzierenden Gewerbe spezialisiert und wissen genau worauf es ankommt.
Ermöglichen Sie es Ihren Mitarbeiter:innen an Befragungen teilzunehmen und räumen Sie ihnen somit ein Mitspracherecht ein. In unserem kostenlosen Guide erfahren Sie alle Details, kompakt und übersichtlich.

Digital Survey Environment
Ask all your employees
functionHR is 100% GDPR compliant and follows strict ethical principles. Participation is completely anonymous and compliant with data protection laws.

Automatic distribution of invitations and reminder emails

Real-time monitoring of participation rate by organizational units

Excellent user experience to ensure high response rates

Provision of individual survey access with QR-Codes, e.g. for employees without their own e-mail address

Personalized links (e.g. to avoid multiple participation) with pseudonymized hash codes without identification of respondents

Option to save and restore results for continuation at a later date (e.g. if the survey is interrupted)

Branded and responsive survey design to optimize use on all common devices

Scalable IT infrastructure to handle different workloads

Paper & pen option for employees without their own device or option to participate digitally
Visualization of Results
Set up interactive dashboards for different user roles
Real-time monitoring: Keep track of survey participation and manage response rates
Access rights: Assign user-specific access rights and roles
Choice of visualizations: Define the visualization of the results yourself by choosing from a variety of chart types such as KPI tables, bar charts, heat maps, impact grids, topic clouds, etc.
Filtering capabilities: Filter your dashboard views as you wish, e.g. by department, location or area of responsibility
Analytics Platform
Integrate and analyze survey data
After the survey is before the analysis: What happens now?
The Employee Survey Platform is fully integrated with the functionHR Analytics Platform. The survey data is automatically analyzed using advanced statistics and AI-supported methods. For even more accurate results, our intelligent software solution also integrates your business data. This allows you to demonstrate the relationship between employee behavior and business KPIs.
This combination of survey data with HR and business data makes the functionHR Platform truly unique.
50 – 300.000
Survey respondents per company
50+
Countries with surveys conducted
6
Awards
100 %
Customer satisfaction
50 – 300.000
Survey respondents per company
50+
Countries with surveys conducted
6
Awards
100 %
Customer satisfaction
Do you want take your employee surveys to the next level?
Get in touch with us!
You are currently viewing a placeholder content from HubSpot. To access the actual content, click the button below. Please note that doing so will share data with third-party providers.
More Information

